| Chapter 222. Events | ||
|---|---|---|
 | Part LXXI. eCos Support for Segger SystemView tracing |  |
Chapter 222. Events
When the CYGBLD_SYSTEMVIEW_ENABLED option is
enabled the eCos run-time will always
generate SystemView thread events. This allows basic application flow
of control between threads to be analysed.
222.1. SystemView Events
The CYGPKG_SYSTEMVIEW package also provides for
generation of records for some other system events.
The following options are enabled by default, but can be disabled to reduce the instrumentation capture load if overflows are encountered.
CYGIMP_SYSTEMVIEW_TRACE_ISR- Used to track ISR (Interrupt Service Routine) entry and exit.
CYGIMP_SYSTEMVIEW_TRACE_TIMERS-
Used to track Kernel alarm function calls. The events wrap the alarm
calls within the Kernel
Cyg_Counter::tick()function. CYGIMP_SYSTEMVIEW_TRACE_HEAP-
Used to track
CYGPKG_MEMALLOCheap creation, allocation and free events. These events can be used to track dynamic memory allocation footprints of an application.
The following image is a screenshot from the SystemView “System” event window highlighting the basic thread and ISR information recorded. It shows a thread named “SimpleTest” being woken, executing for 2.704ms before sleeping and the idle thread executing again.
Figure 222.1. Example from application with SEGGER_SYSVIEW_Mark() use
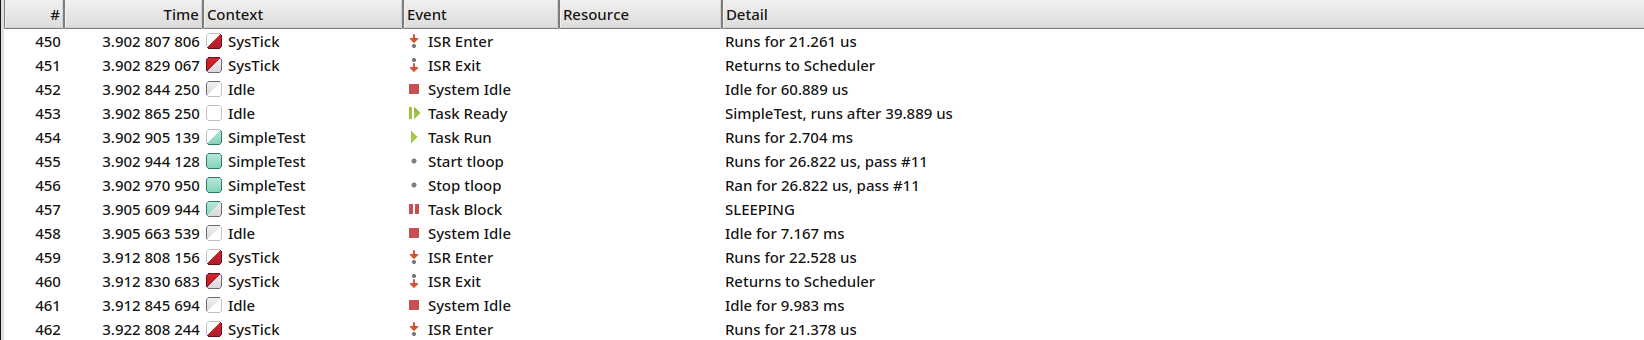
Aside: The above example also highlights the use of an application
generated SystemView “marker”. The events
#455 and #456 show the
application marked block with the name tloop took
26.822us for the 11th execution of the code covered
by the marker.
222.2. Kernel Instrumentation
If the eCos Kernel instrumentation
(CYGPKG_KERNEL_INSTRUMENT) feature is enabled along
with the CYGBLD_SYSTEMVIEW_KERNEL_INSTRUMENT option
then CYGPKG_SYSTEMVIEW provides a wrapper header
(CYGBLD_KERNEL_INSTRUMENT_WRAPPER_H) to replace the
Kernel package implementation with code to generate SystemView events.
![[Note]](pix/note.png) | Note |
|---|---|
In this case the normal Kernel instrumentation options
|
The specific CYGPKG_KERNEL instrumentation types
can then be manually enabled/disabled as required for the SystemView
analysis being performed. e.g. CYGPKG_KERNEL_SCHED
instrumenting low-level scheduler events can be disabled to save on
bandwith; if tracking thread and synchronisation object events is
sufficient for the analysis.
Similarly, most packages that make use of Kernel instrumentation do so as eCos configuration conditionals.
These low-level kernel instrumentation events can provide very low-level detail of the inner processing of eCos, and the application use of kernel scheduling objects, but it can generate vast amounts of trace data.
The following image is a screenshot from the SystemView
“System” event window which highlights the level of detail
available when Kernel instrumentation is enabled. Entry
#60098 is the start of a mutex lock operation, with
the lock call completing after 215.839us as shown
by entry #60102.
Figure 222.2. Example from application with Kernel instrumentation enabled
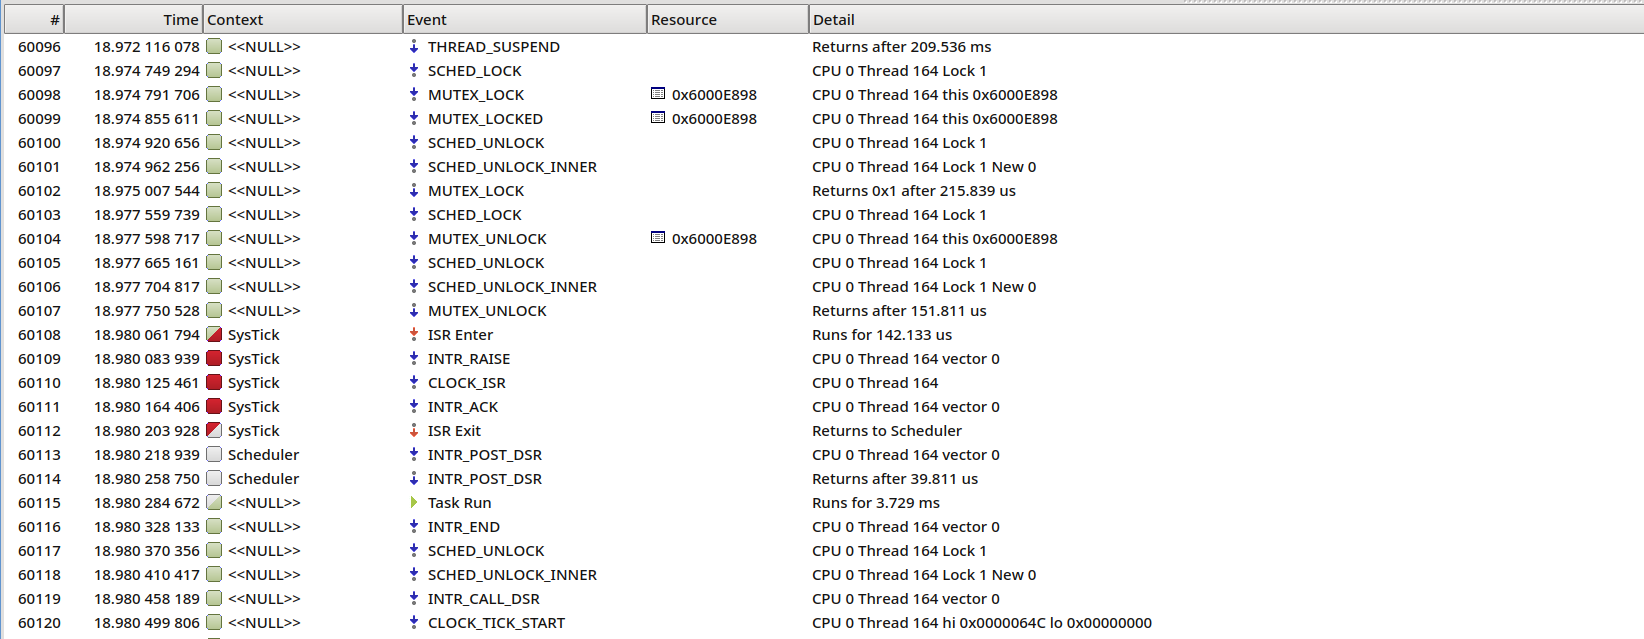
The above screenshot is from an execution of the
CYGPKG_KERNEL test mutex3, where
the created thread has not been given a name, hence the empty thread
name being displayed as <<NULL>>. This
example was captured on the eCos stm32f746g_disco
target platform (executing at 168MHz and using the UART HAL Recorder
with a baud rate of 2MHz).
![[Warning]](pix/warning.png) | Warning |
|---|---|
When using eCos itself to support the
It is recommended to use, when available for the selected target, the
lower-level |
222.3. Infra Trace
In extremis, the Infrastructure (CYGPKG_INFRA)
package option CYGDBG_USE_TRACING can be enabled in
conjunction with selecting
CYGDBG_INFRA_DEBUG_TRACE_ASSERT_SYSTEMVIEW as the
trace destination output module.
This feature will provide a trace of the execution of suitably annotated functions. This will mostly be similar in nature to the information that can be obtained from enabling (the lighter weight) Kernel instrumentation, but can be useful for developers wishing to understand the location of the source for the code being executed.
| Note |
|---|---|
The use of this feature is not normally recommended, but can be useful for some investigation/analysis cases.
The recording of long strings via the SystemView
If detailed eCos operation is required then normally Kernel
instrumentation would be sufficient, and whilst it can also generate
significant amounts of trace data it will be less than the overhead of
the |
The following image highlights the style of Tracing output generated.
The Detail entries are prefixed with the
<source-filename>[source-line#]<function-name>
fields, which are then followed by the Tracing specific message text.
Figure 222.3. Example from application using INFRA trace
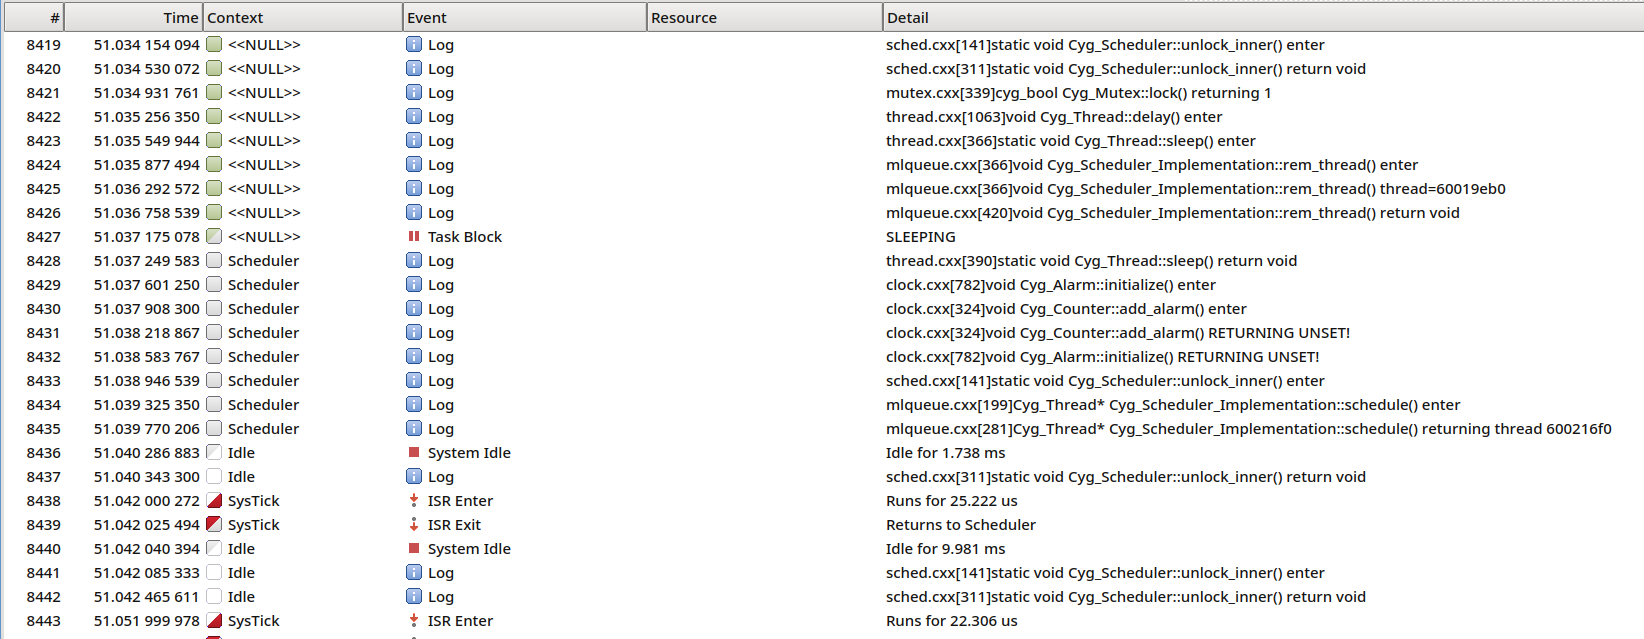
The example above was captured on the eCos
stm32f746g_disco target platform (executing at
168MHz and using the UART HAL Recorder with a baud rate of 2MHz).
| |  | |
| Chapter 221. SystemView Recording |  | Chapter 223. Configuration |
| 2024-03-18 | eCosPro Non-Commercial Public License |