| Chapter 4. Debugging eCos applications | ||
|---|---|---|
 |  | |
Chapter 4. Debugging eCos applications
Table of Contents
4.1. eCos Launch Configurations
In the normal development cycle of eCos application development, once an application executable has been built, the application must be launched on the target hardware from where it is executed and debugged. This involves the creation of an eCos launch configuration which specifies to Eclipse and the eCosPro Eclipse/CDT plug-in how the binary executable can be placed on the target hardware and executed.
![[Tip]](pix/tip.png) | Tips |
|---|---|
|
The eCosPro Eclipse/CDT plugin provides two types of eCos launch configurations:
The target hardware is running a bootstrap monitor such as RedBoot, or a debug monitor such as GDB stubs, which permit the remote download and debugging of the application on the target hardware through either a serial port or over a network using TCP/IP.
The target hardware is connected to a hardware debugger, such as the Ronetix PEEDI or the OpenOCD Open On-Chip Debugger.
4.1.1. Method 1 for creating eCos Launch Configurations
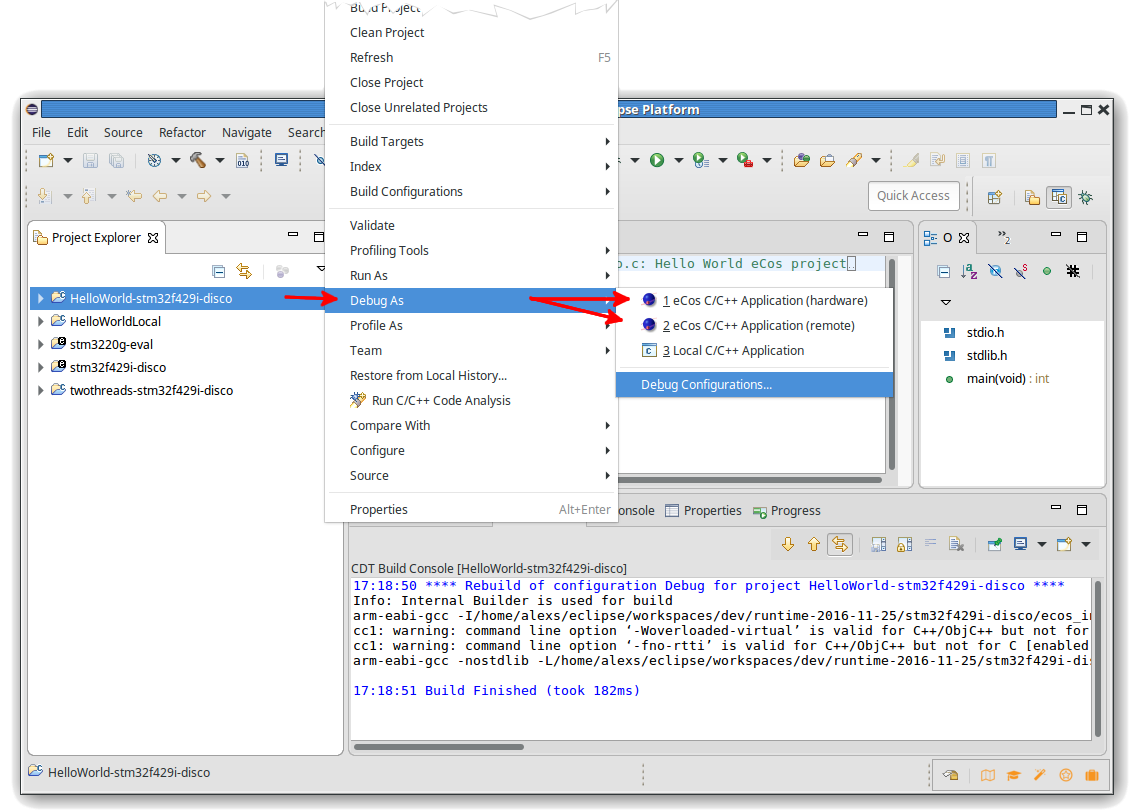
To create a launch configuration, mouse click on the application project within Eclipse's project explorer, select either → or → , depending on whether you will use either eCos Remote Debugging or eCos Hardware Debugging respectively, as illustrated in Figure 4.1, “Creating eCos launch configurations”.
If no launch configurations of the corresponding type exist, the corresponding dialog illustrated in either Figure 4.5, “eCos Remote Debugging dialog” or Figure 4.6, “eCos Hardware Debugging dialog” will appear in order to allow you to create one. If the eCos Application Project contains more than one binary executable, you will also be asked to select the executable to be launched. Once created, the configuration is launched.
If one launch configuration of the corresponding type already exists, it will be be launched immediately.
If more than one launch configuration of the corresponding type already exists, you will be prompted to select a launch configuration which will be immediately launched.
Follow the corresponding instructions in either Section 4.2, “eCos Remote Debugging” or Section 4.3, “eCos Hardware Debugging” to walk-through the remainding process of debugging an example eCos application on your target.
Figure 4.1. Creating eCos launch configurations
4.1.2. Method 2 for creating eCos Launch Configurations
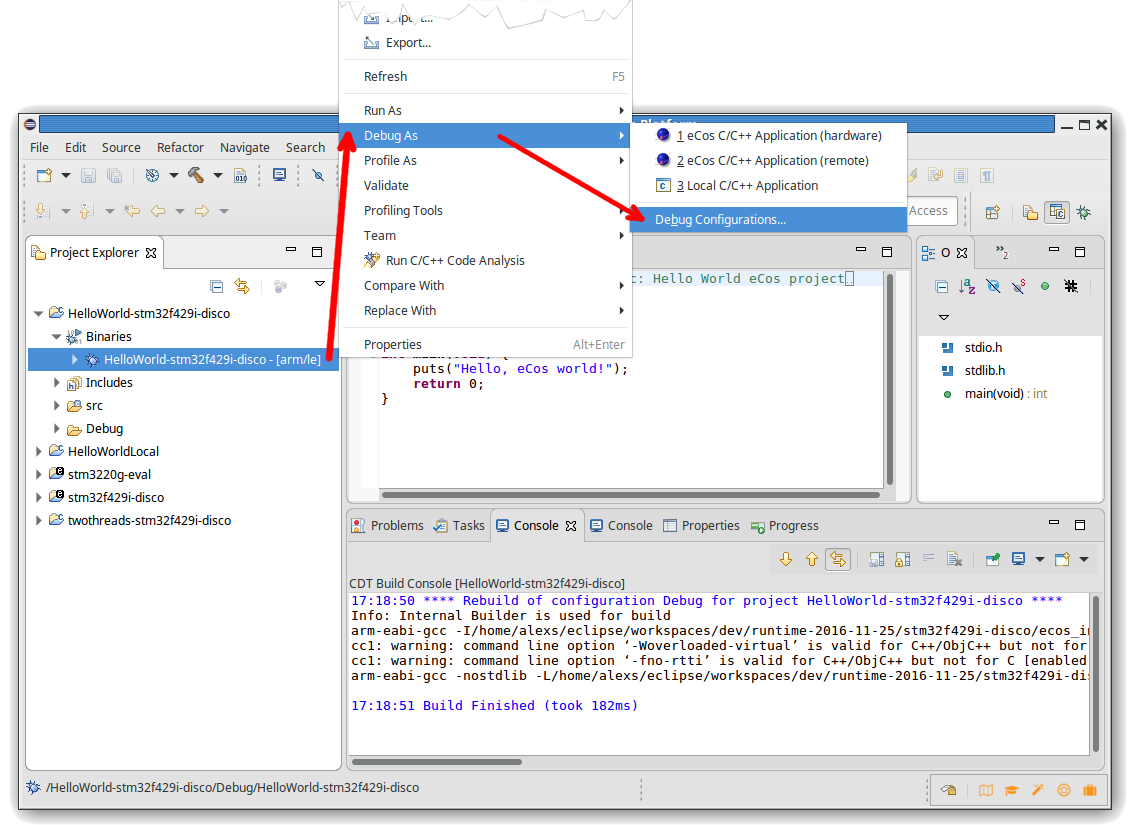
If within the Project Explorer window you open up the eCos Application Project and mouse click on the application binary followed by → as illustrated in Figure 4.2, “Selecting eCos launch configuration types”.
Figure 4.2. Selecting eCos launch configuration types
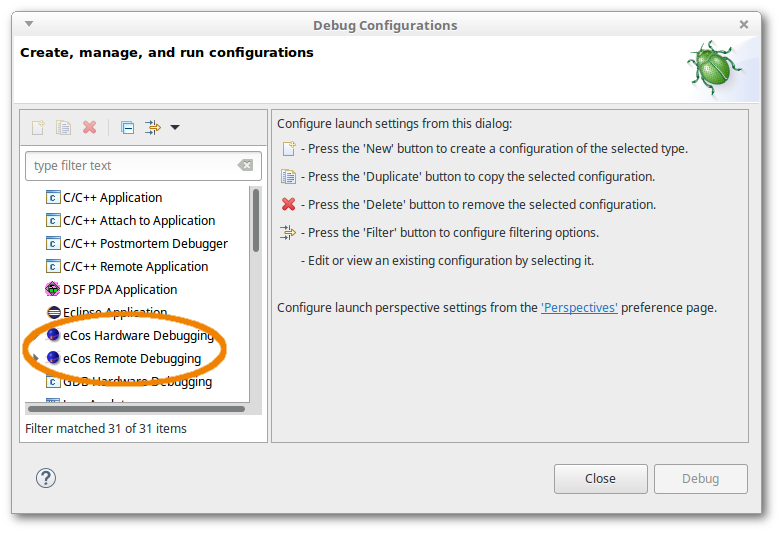
The dialog illustrated Figure 4.3, “eCos launch configurations” should appear.
Figure 4.3. eCos launch configurations
Now either:
on the option illustrated in Figure 4.3, “eCos launch configurations”. The right-hand side of the dialog will then be populated with the options as illustrated in Figure 4.5, “eCos Remote Debugging dialog”; or
on the option illustrated in Figure 4.3, “eCos launch configurations”. The right-hand side of the dialog will be populated with the options as illustrated in Figure 4.6, “eCos Hardware Debugging dialog”.
Follow the instructions in either Section 4.2, “eCos Remote Debugging” or Section 4.3, “eCos Hardware Debugging”, as appropriate, to walk-through the process of debugging an example eCos application on your target.
![[Note]](pix/note.png) | Note |
|---|---|
If you do not select or have an eCos binary highlighted when you create any eCos launch configuration, you will get an error of the form illustrated in Example 4.1, “Executable Not Highlighted”. This is because the context of the Project Explorer provides the project or application for which a launch configuration is to be created and it is only possible to create eCos launch configurations for eCos applications. Example 4.1. Executable Not Highlighted An error has occured. See error log for more details. Project selected is not an Ecos Application project. |
4.1.3. Method 3 for creating eCos Launch Configurations
Open the eCos Application's properties dialog window by highlighting the eCos application project within the window of the C/C++ perspective through the menu option → (Alt+Enter) or by → , and select . Existing launches, if any, will appear in the left-hand panel. To create a new launch, select and the dialog illustrated in Figure 4.4, “Select Configuration Type” will appear.
Figure 4.4. Select Configuration Type
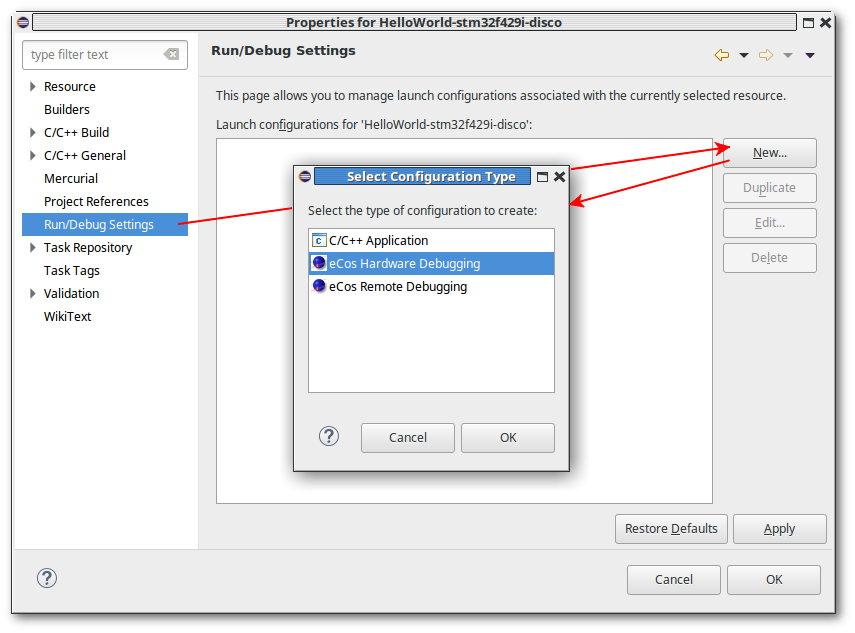
Select either or followed by and follow the instructions provided in the corresponding section.
4.2. eCos Remote Debugging
eCos Remote Debugging requires the use of a bootstrap debugger such as RedBoot or GDB stubs which must be installed on your hardware before you can commence eCos Remote Debugging. Please refer to the target hardware documentation accompanying your eCosPro release and indexed from within the release documentation index page for detailed instructions on how to install either RedBoot or GDB stubs on your hardware.
4.2.1. eCos Remote Debugging launch configuration
These steps follow on from the Project Creation walkthrough, showing how one might go on to use an Eclipse debug session to launch a sample Hello World application on a target running a bootstrap monitor such as RedBoot.
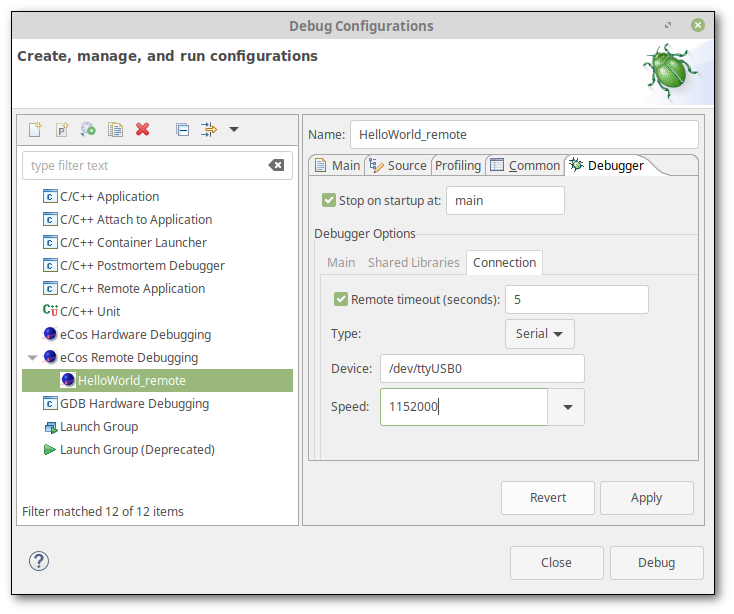
At this point you should see a dialog similar to that illustrated in Figure 4.5, “eCos Remote Debugging dialog” below, although the exact appearance of the dialog may differ according to how you initiated the creation of the launch configuration. For example, the left-hand panel may not be present, or the buttons , , or may either not all be present or be named differently.
Figure 4.5. eCos Remote Debugging dialog
| Notes: |
|---|---|
|
Choose an appropriate name if the default name is not suitable, select the Debugger tab and choose the connection type, modifying the settings as appropriate in order to access the target hardware. For example:
If you are connecting via ethernet to RedBoot on the target:
Select
TCPfor the Type and specify the IP address or host name and Port number of RedBoot. The default Port number of RedBoot is9000.If you are connecting via serial to RedBoot or GDB stubs on the target:
Select
Serialfor the Type and specify the Device and Speed (baud rate) used by RedBoot or GDB stubs. For Windows hosts, the device may beCOMn, while for Linux platforms this should be the full path of your serial device (e.g./dev/ttyUSBn).
Press to save the configuration followed by either or .
If you came to this dialog through the option of the dialog for the eCos application project as described in Section 4.1.3, “Method 3 for creating eCos Launch Configurations”, you will need to use one of the other methods described in Section 4.1.1, “Method 1 for creating eCos Launch Configurations” or Section 4.1.2, “Method 2 for creating eCos Launch Configurations” or to deploy the launch configuration as described in those sections.
Continue the debug walkthrough as described in Section 4.4, “Running and Debugging the application”.
| Note |
|---|---|
Launching an eCos Remote Debugging session to a remote target, particularly when connected over a serial line, can be prone to spurious errors. Be sure to use a suitable Remote timeout and allow for sufficiently long time between resetting your target board, allowing debug monitors such as RedBoot to bootstrap the target fully, and starting a debug session from Eclipse. |
4.3. eCos Hardware Debugging
To interactively debug an application built to execute from flash memory, or from RAM without a bootstrap monitor such as RedBoot or GDB stubs, you must normally use a hardware debugger such as OpenOCD or the Ronetix PEEDI (PEEDI). Most hardware debuggers present a GDB protocol interface and so may be used in the same way as RedBoot or GDB stubs on a target board.
4.3.1. eCos Hardware Debugging differences
The main differences between eCos Remote Debugging and eCos Hardware Debugging are:
Hardware debuggers generally do not provide thread-level debugging information or require their own custom configuration to determine operating system specific thread information. Unless your hardware debugger is suitably configured, you will not be able to browse the list of active threads - your application will appear to consist of a single thread no matter how many it has and you cannot make a breakpoint thread-specific.
Console output and output to the
/dev/haldiagor/dev/ttydiagdevices may be configured within an eCos configuration to be displayed in the Eclipse console, regardless whether the target hardware has any external I/O capability. This is a very useful facility and may be used by all targets running eCosPro applications which are launched using the eCos Hardware Debugging launcher. An example of how to create such an eCos configuration is described in Section 4.3.2, “eCos Configuration for eCos Hardware Debugging”.![[Warning]](pix/warning.png)
Warning This form of output requires the use of an additional breakpoint which may not always be available. If no additional breakpoints are available, developers will be restricted to using the target's external devices (if any).
Should the target hardware have an external device to which output to the
/dev/haldiagor/dev/ttydiagdevices is sent, for example an RS232 serial device, this output may be captured and displayed in the Eclipse console. To acheive this, set the Console connection value within the Debugger tab to eitherSerial(configuring the host's serial port and speed as appropriate) orTCP(configuring the host name and TCP port number as appropriate) to read diagnostics output from either source. Leave the setting asGDBshould eCos diagnostic output be configured to come through GDB.Note These configuration options are only available through eCosPro enhancements, the eCosPro CDT plug-in and eCosPro GNU Toolchains.
Applications executing from flash memory cannot use ordinary (“soft”) breakpoints; they can only use hardware breakpoints.
Hardware breakpoints are set in essentially the same way as soft breakpoints, that is by -clicking in the ruler of a source code window. To set a hardware breakpoint, first select C/C++ Hardware Breakpoints from the Breakpoint Type submenu, then select Toggle Breakpoint as before.
![[Caution]](pix/caution.png)
Caution Most targets are limited in the number of hardware breakpoints they support, and such limits are not automatically reported to gdb or to Eclipse. If you attempt set too many, your debug session is likely to become confused. If you know the limit for your target, you can provide a limit in a GDB command file (see Section 4.8, “GDB command files”) with the command shown in Example 4.2, “Set Hardware Breakpoint Limit”.
Example 4.2. Set Hardware Breakpoint Limit
set remote hardware-watchpoint-limit N
Tip If you run out of hardware breakpoints unexpectedly, look for and disable the option to Automatically stop on main at startup in the debugger config panel.
Some hardware debuggers provide settings in their configuration files which allow developers to map requests for software breakpoints into hardware breakpoints. If you have trouble setting the type of breakpoint you expected, be sure to also check the settings in the hardware debugger's configuration file. For example, with the Ronetix PEEDI, it is configured with the
CORE0_BREAKMODEdirective which may be set to eithersoftorhard.Some hardware debuggers, like OpenOCD, may require that you reset and halt the target before downloading the executable to the target. Most recent eCosPro releases are provided with OpenOCD configuration files that result in OpenOCD performing these operations immediately on accepting a remote connection from GDB. However, if you are using a different hardware debugger and either your hardware debugger or your target require these operations, you must configure these options in the eCos Hardware Debugging launch configuration.
4.3.2. eCos Configuration for eCos Hardware Debugging
Continuing the steps of Chapter 3, Quick Start / Walkthrough, this section describes how to modify the eCos configuration such that output or diagnostics from the application being developed are directed to the Eclipse console through GDB.
The latter is a feature unique to eCosPro and eCosCentric-provided GNU toolchains which will work across all hardware debuggers, halting the hardware temporarily only when output occurs for the duration the output can be extracted from the target by GDB. Less intrustive methods, such as utilising the instrumentation trace macrocell (ITM) provided by certain ARM architectures, are also available. See Section 4.6, “Using ARM's Instrumentation Trace Macrocell for output” for an example.
If you have open the Debug Configurations dialog illustrated in Figure 4.2, “Selecting eCos launch configuration types”, select to close the dialog and return to the C/C++ project explorer perspective ( → → → → → or through the perspective button illustrated by the speach bubble in Figure 3.13, “Build Progress”).
Open up the eCos configuration project associated with the application you wish to debug within the C/C++ project explorer and look for the active eCos configuration file. This will have an
.eccextension and will normally be calledecos.ecc. Open this file for editing with the eCos configuration tool either by on this file, or by selecting the file and pressing F3, or by -clicking the file and selecting .If you have not already turned off compiler optimizations, do that now. See Disable optimizations for further details.
Find the
CYG_HAL_STARTUPmacro using the search dialog (see Disable optimizations for an example) and modify the startup type to one that is suitable for your target and hardware debugger (for example,JTAG), within the configuration tree accepting the changes by pressingReturn. Accept any conflict resultions which the eCos configuration tool may present to you.Note Your target may contain strict rules that inhibit the
CYGFUN_HAL_DIAG_VIA_GDB_FILEIOmacro from being enabled (see next step) unless startup type with an association to GDB is chosen.Find the
CYGFUN_HAL_DIAG_VIA_GDB_FILEIOmacro using the search dialog and enable it within the configuration tree. This will likely result in a conflict which, when resolved, will cause theCYGFUN_HAL_GDB_FILEIOto be enabled. This is the correct resolution and expected behaviour. On some target platforms (for example the CortexM®) there may be additional hardware-specific resolutions (for example,CYGHWR_HAL_CORTEXM_DIAGNOSTICS_INTERFACEis set togdb_hwdebug). Accept any conflict resultions which the eCos configuration tool may present to you.Save your configuration, → (Ctrl+S), and exit the configuration tool, → (Alt+X).
Your eCos configuration project will automatically be rebuilt if eCos configuration builds have not been inhibited for the project ( → disabled) as well as your application project if automatic builds have been enabled ( → enabled). Ensure both eCos and your application project are rebuilt if either of the above settings are not as indicated.
Create the eCos Hardware Debugging launch configuration as described in Section 4.3.3, “eCos Hardware Debugging launch configuration”.
4.3.3. eCos Hardware Debugging launch configuration
The following steps continue on from Chapter 3, Quick Start / Walkthrough and Section 4.3.2, “eCos Configuration for eCos Hardware Debugging” to launch a sample Hello World application on a target using a hardware debugger.
4.3.3.1. eCos Hardware Debugging using OpenOCD
In this example we show you how to use OpenOCD to debug your application, but most of this walkthrough can be applied to other hardware debuggers as well. See Section 4.7, “eCos Hardware Debugging using the Ronetix PEEDI” for an example of how to use the Ronetix PEEDI.
mouse click on the application binary within Eclipse's project explorer, or select Debug As followed by Debug Configurations as illustrated in Figure 4.2, “Selecting eCos launch configuration types”, to return to the the dialog window illustrated in Figure 4.3, “eCos launch configurations” and described in the beginning of this chapter.
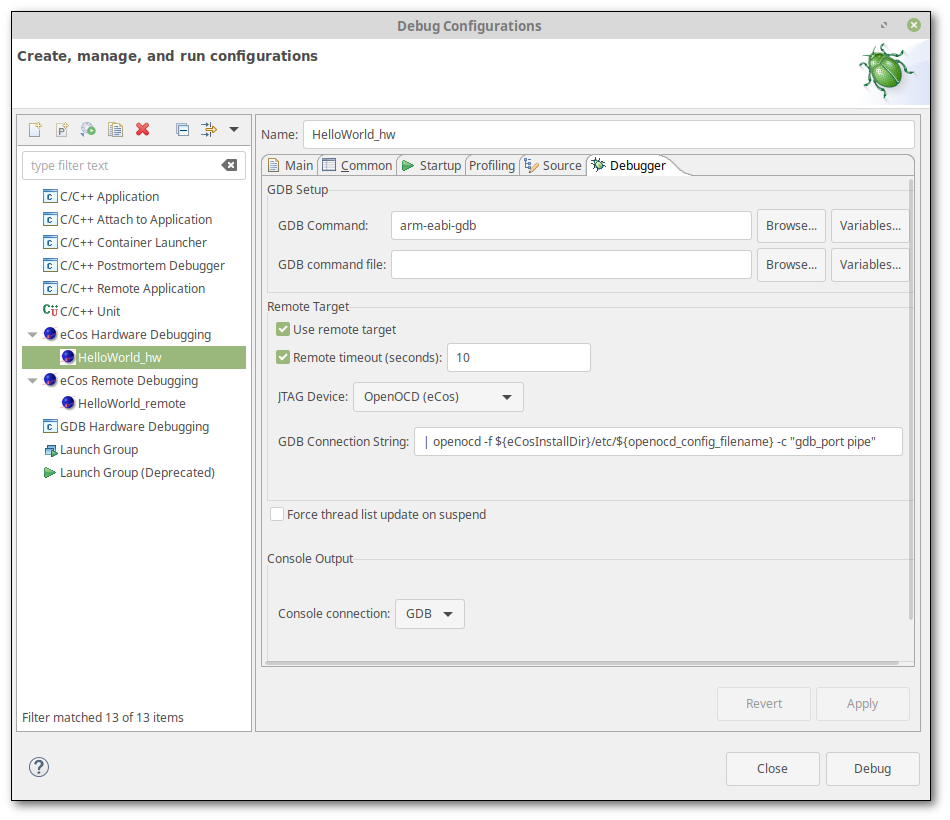
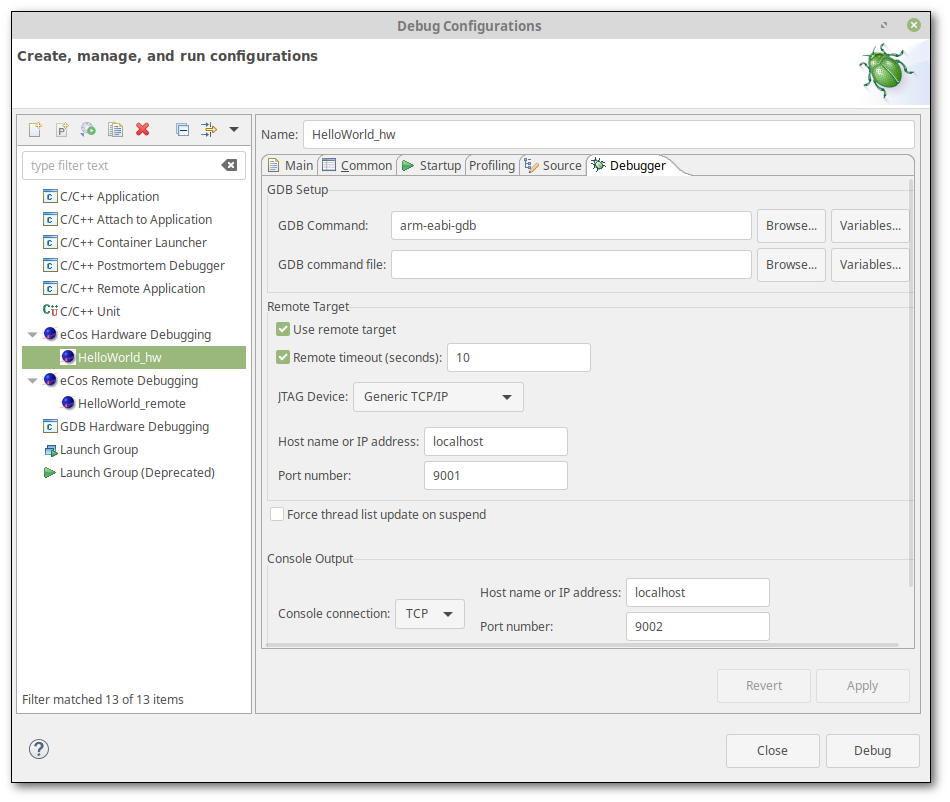
Once the “Debug Configurations” dialog illustrated has been opened, on the eCos Hardware Debugging option illustrated in Figure 4.3, “eCos launch configurations”. The right-hand side of the dialog will be populated with the eCos Hardware Debugging options as illustrated in Figure 4.6, “eCos Hardware Debugging dialog”. Choose an appropriate name if the default name is not suitable.
Choose
OpenOCDas your JTAG Device and ensure that Use remote target is checked and that the GDB Connection String is set as illustrated in Example 4.3, “GDB Connection to OpenOCD pipe”.Example 4.3. GDB Connection to OpenOCD pipe
| openocd -f ${eCosInstallDir}/etc/${openocd_config_filename} -c "gdb_port pipe"If you are using a different hardware debugger, select the Debugger tab and choose the connection type, modifying the settings as appropriate in order to access the target hardware.
Figure 4.6. eCos Hardware Debugging dialog
Notes Modern eCosPro distributions have a build system that places usable or example hardware debugger configuration files in the
etcsubdirectory of the eCos installation tree during the build process of the eCos library, or after creating an eCos build tree and executing the command make etc. These files are specific to a target, eCosPro configuration and hardware debugger and use common names, permitting pre-defined pipe commands to be used as may be seen in the OpenOCD example above.The default pre-defined pipe command for OpenOCD uses the
${eCosInstallDir}and the${openocd_config_filename}Eclipse macros to select the appropriate configuration file for the target to provide portabilty and flexibility of the launch configuration.The Remote timeout field is active when checked with a non-zero integer value in the corresponding field and has been set by default with a value suitable for starting up OpenOCD on slower/older PCs. The gdb default remote timeout of 2 seconds can be insufficient in some circumstances.
Should the eCos Configuration direct the eCos devices
/dev/haldiagor/dev/ttydiagto external devices available on the target hardware, for example an RS232 serial device, to view this output within the Eclipse console set the Console Connection value within the Debugger tab to eitherSerial(configuring the host's serial port and speed as appropriate) orTCP(configuring the host name and TCP port number as appropriate). Leave the setting asGDBshould eCos diagnostic output be configured to come through GDB.The default destination of the output depends on the hardware and specific platform port, as well as the default settings of the eCosPro configuration, but in many cases it will come from an RS232 serial device or ITM port (if available, in which case it may be read from a TCP port through OpenOCD).
Select to save your launch profile followed by and continue the debug walkthrough as described in Section 4.4, “Running and Debugging the application”.
4.4. Running and Debugging the application
When launching a debug session for the first time, you will be prompted whether you wish to switch to the debug perspective as illustrated below in Figure 4.7, “Confirm Perspective Switch dialog”.
Figure 4.7. Confirm Perspective Switch dialog
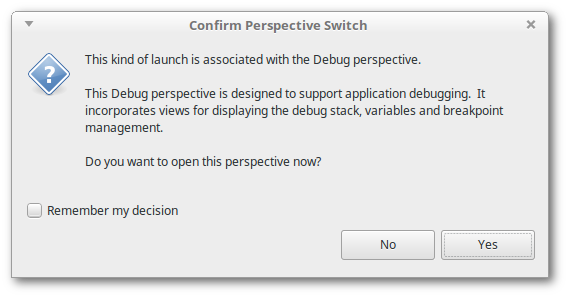
Optionally check Remember my decision if you wish to switch to the Debug Perspective each time you launch a debug session.
Select to continue to have Eclipse open the Debug perspective illustrated in Figure 4.8, “Debug Download Execution”.
Figure 4.8. Debug Download Execution

You may not see the exact contents of the previous figure until the download of your application has completed and execution started.
If the debug perspective is not opened due to some previous preference selection, open it now. You may open or return to the debug perspective at any time by selecting the Bug button called out by the speach bubble in Figure 4.8, “Debug Download Execution”, or through the following menu selections: → → → → → . These menu options may vary slightly if the debug perspective has previously been selected. For example: → → → → .
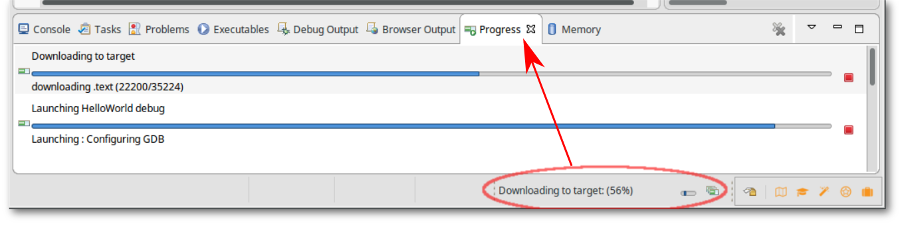
When a debug session is launched, the debug launcher will download the binary application to the target and commence execution, stopping at
main()if you left that option enabled (or an alternative function such ascyg_user_start()if you changed the default function name within the launch configuration). Within the Debug perspective you may view the more detailed Progress tab by on the Progress bar circled in red in Figure 4.9, “Debug Download Progress”.Figure 4.9. Debug Download Progress
If you stopped at
main(), press the Resume toolbar button as illustrated by the mouse cursor in Figure 4.8, “Debug Download Execution”. Execution continues; on most hardware targets the output, your Hello eCos World message, is sent over the board's debug channel and is reported in the Console view illustrated in Figure 4.8, “Debug Download Execution”. The remaining buttons, highlighted by the speech buttons are as follows:Pause current execution.
Stop the current execution.
Disconnect from the remote target.
Step into the function, if any, otherwise execute the current instuction.
Step over the function, if any, otherwise execute the current instuction.
Return from the current function call.
For debugging your own application, you may set breakpoints and perform other debugger oprtations before resuming or stepping through your application. While your application is running, you may also pause the application to inspect variables, threads, the call stacks, memory and so on, or simply halt your debug session.
Note Pausing your application through
eCos Remote Debugginglaunch configurations is only possible when the debug monitor (such as RedBoot) is active. For example, when your application performs an output operation such aprintf()through the debug monitor using a gdb debug channel.
4.5. Console Diagnostics Output
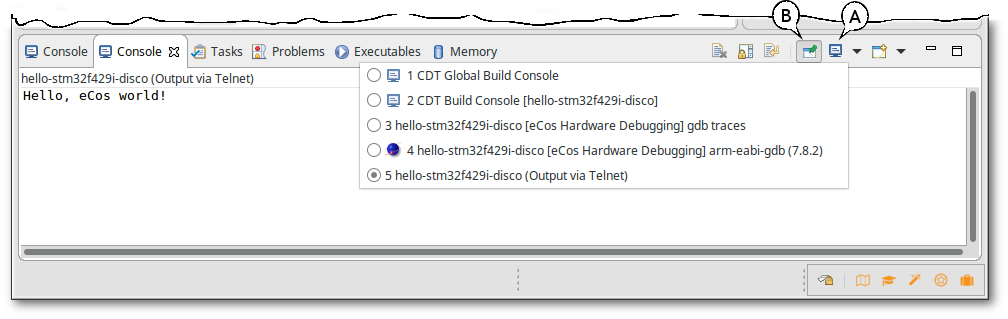
The perspective includes the Console tab window, seen also within the perspective, in which a number of different consoles may be viewed including:
GDB output ([eCos Remote Debugging] xxx-gdb or [eCos Hardware Debugging] xxx-gdb - any output produced by the underlying xxx-gdb command)
GDB traces ([eCos Remote Debugging] gdb traces or [eCos Hardware Debugging] gdb traces)
Application debug output (Output via zzz)
By default, the GDB output is displayed by the
perspective in the Console
tab. This will include information such as the breakpoint
information, tracepoints and so on. The eCosPro CDT plug-in provides a
diagnostics console in which diagnostics output or output from the
application running on the target will appear. You may choose the output
which appears in the Console tab by pressing the
button highlighted by
the “A” callout box and choosing the
desired console from the dropdown menu illustrated in
Figure 4.10, “Console Diagnostics Output”.
Figure 4.10. Console Diagnostics Output
When the application produces any diagnostic output, the
Console tab window will switch to the
Application debug output from the GDB
output, and similarly it will revert to displaying the
GDB output when the underlying xxx-
gdb command produces any information of it's own (for example,
when a breakpoint is hit). The Console tab window
may also be pinned to a selected console by first choosing the console
using the button
highlighted by the “A” callout box,
choosing the desired console in the resulting menu dropdown, and
selecting the button highlighted by
the “B” callout box illustrated in Figure 4.10, “Console Diagnostics Output”.
The diagnostic output is normally routed through GDB and either (i) RedBoot or GDB stubs; or (ii) from an external source such as a serial device, ITM port or TCP/IP socket. The source of the diagnostic output from the target application is defined by the eCos configuration and configured within the eCos Hardware Debugging launcher for Eclipse. An example of this is described in Section 4.6, “Using ARM's Instrumentation Trace Macrocell for output”.
4.6. Using ARM's Instrumentation Trace Macrocell for output
This section provides an example how to create an eCosPro configuration that will direct diagnostic output through ARM's Instrumentation Trace Macrocell (ITM) on a Cortex-M target to OpenOCD running on the development host from where it may be picked up and displayed on the Eclipse console.
This facility is particularly useful where you may have timing-dependant operations or devices on your target hardware that need servicing and cannot afford the latency overhead required to provide diagnostics output through GDB, Eclipse or other third-party plug-ins. Diagnostic output is directed to an ITM channel from where it may be decoded on a host and presented to the developer within an Eclipse console.
| Note |
|---|---|
When large amounts of diagnostic data are produced, certain host or hardware debuggers may not be able to capture, or keep up with the display of, all the diagnostics information due to their slower speeds. In such circumstances the loss may range from a few characters through to large chunks of data. |
4.6.1. Configuring eCosPro for ITM output
Within Eclipse, open the configuration project and select the active configuration file (
.eccextension) for editing using the eCos Configuration Tool by on the filename.Within the eCos Configuration Tool, from the default configuration for your target, open the Find in configuration dialog: → (Ctrl+F)
Within the Find in configuration dialog, type
CYGHWR_HAL_CORTEXM_DIAGNOSTICS_INTERFACEinto the Find what: field, ensure Search in: is set toMacro Namesand select .That should take you to the option Interface to use for HAL diagnostics. Within the drop-down to the right, select
ITMfollowed byReturn.Set the
CYG_HAL_STARTUPstartup type toJTAGas illustrated in Section 4.3.2, “eCos Configuration for eCos Hardware Debugging”.Save the configuration, → (Ctrl+S), clean the project → , build the library → (F7), open two terminal (shell) windows → (and again → ), and exit the configuration tool, → (Alt+X).
These operations build a new eCos library, but also open new shell terminals from which OpenOCD may be launched to accept GDB connections, and also a parseitm session that will allow the ITM diagnostics output to be read by Eclipse/CDT from a
TCPport.
4.6.2. Using OpenOCD to capture eCosPro ITM output
OpenOCD configuration files provided by
eCosCentric will have been preconfigured to capture ITM output to the
default file tpui.out, so little is required of
the developer in this regard. eCosCentric host tools also include an
application, parseitm, which is used to
extract from the tpui.out file the diagnostics
output generated by a running eCos application, and pass this onto
the standard output stream.
In this mode of development OpenOCD is run as a GDB Server on the devlopment host, providing a port for Eclipse, through GDB, to connect to so it can download, execute and allow debugging of the application on the target hardware. parseitm is used to extract the diagnostics output to a TCP stream which is read by Eclipse
Within the first terminal shell window opened, run the command illustrated in Example 4.4, “Running OpenOCD”. You may change
ecos_installto be either${ECOS_INSTALL_DIR}(bash) or%ECOS_INSTALL_DIR%(Windows cmd) and the port number9001in accordance with your own system and requirements.Example 4.4. Running OpenOCD
%
openocd -f" Open On-Chip Debugger 0.9.0 (2016-06-27-01:12) Licensed under GNU GPL v2 For bug reports, read http://openocd.org/doc/doxygen/bugs.html Info : The selected transport took over low-level target control. The results might differ compared to plain JTAG/SWD adapter speed: 2000 kHz adapter_nsrst_delay: 100 none separate srst_only separate srst_nogate srst_open_drain connect_deassert_srst Info : Unable to match requested speed 2000 kHz, using 1800 kHz Info : Unable to match requested speed 2000 kHz, using 1800 kHz Info : clock speed 1800 kHz Info : STLINK v2 JTAG v23 API v2 SWIM v0 VID 0x0483 PID 0x3748 Info : using stlink api v2 Info : Target voltage: 2.892416 Info : stm32f4x.cpu: hardware has 6 breakpoints, 4 watchpointsecos_install/etc/openocd.cfg -c "gdb_port9001Within the second terminal shell window opened, run the command illustrated in Example 4.5, “Running parseitm”. You may change
tpui.outand the server port number9002in accordance with your own system configuration and requirements.Example 4.5. Running parseitm
%
parseitm -p 31 -fparseitm daemon started, listening on port 9002, pid=8204.tpiu.out-s9002Example 4.6. Terminating a parseitm daemon
%
telnetTrying 127.0.0.1... Connected to localhost. Escape character is '^]'.localhost9002shutdownConnection closed by foreign host.Notes: The above examples illustrates usage on a Linux system. parseitm will not run as a daemon or service on Windows.
To terminate a parseitm daemon, telnet to the parseitm port and type the command shutdown as illustrated in Example 4.6, “Terminating a parseitm daemon”. On Windows, you can also use the keypress Ctrl+C within the terminal shell window.
4.6.3. Configuring eCosPro CDT plug-in for ITM output
Return to the Debugger tab of the dialog illustrated in Figure 4.6, “eCos Hardware Debugging dialog” as described in Section 4.3.3, “eCos Hardware Debugging launch configuration”.
Within the section illustrated in Figure 4.11, “Hardware Launcher - ITM output via TCP/IP port”,
Check Use remote target, if it is not already selected
Select
Generic TCP/IPwithin the JTAG Device: dropdown.Enter
localhostinto the Host name or IP address: field.Enter
9001into the Port number: field.
Within the section illustrated in Figure 4.11, “Hardware Launcher - ITM output via TCP/IP port”,
Select
TCPwithin the Console connection: dropdown.Enter
localhostinto the Host name or IP address: field.Enter
9002into the Port number: field.
Within the section illustrated in Figure 4.11, “Hardware Launcher - ITM output via TCP/IP port”,
Select
TCPwithin the Console connection: dropdown.Enter
localhostinto the Host name or IP address: field.Enter
9002into the Port number: field.
Select the to save the changes followed by to begin a debug session. Refer to Section 4.4, “Running and Debugging the application” for more information on running and debugging the application.
Figure 4.11. Hardware Launcher - ITM output via TCP/IP port
4.7. eCos Hardware Debugging using the Ronetix PEEDI
To use a Ronetix PEEDI hardware debugger to debug your eCos Application Project select
PEEDI as the JTAG Device and the
right-hand panel of the eCos Hardware Debugging
launch configuration will change to allow you to enter the
Host name or IP address and the Port
number (the GDB port number) of the PEEDI as illustrated in
Figure 4.12, “PEEDI Hardware Debugging launch configuration”.
You may also specify the source of debug or informational messages
which are to appear in the Console
Output through the Console connection
option. See Section 4.3.2, “eCos Configuration for eCos Hardware Debugging”
for additional information on configuring eCosPro to provide
these messages through the GDB connection of the PEEDI.
Figure 4.12. PEEDI Hardware Debugging launch configuration
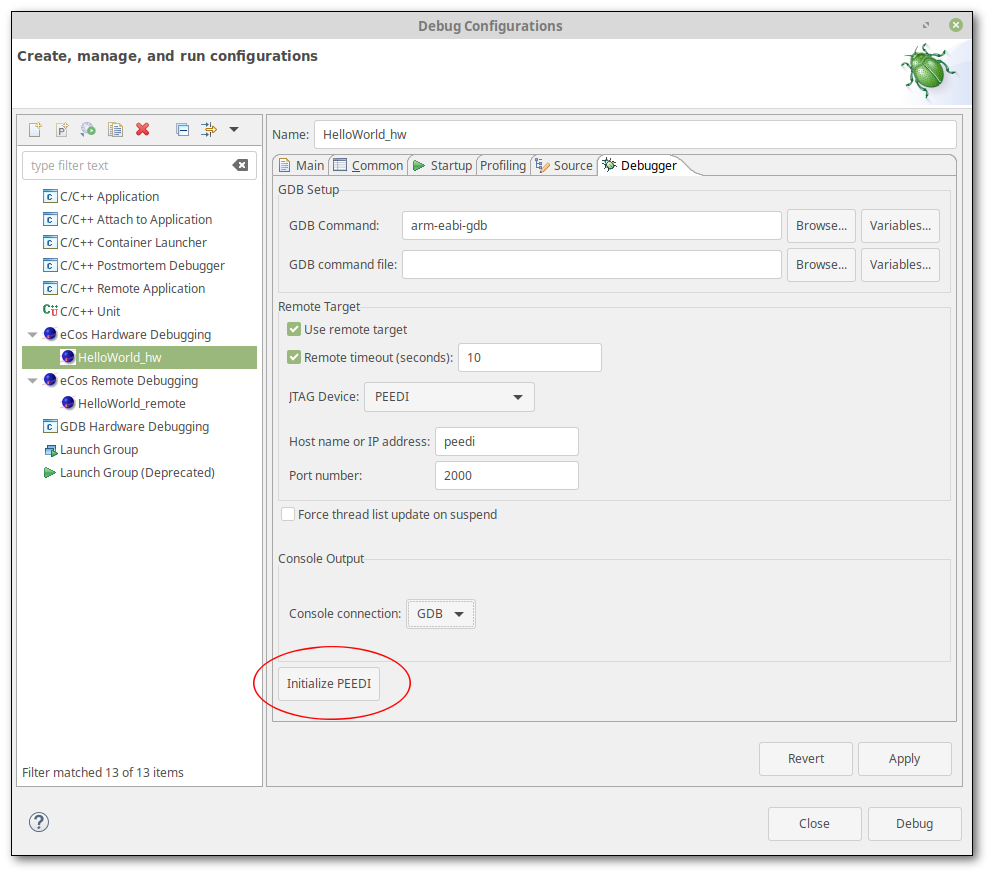
Once your PEEDI has been appropriately configured and initialised to debug your target hardware (see Section 4.7.2, “Configuration and Initialization”) select to save your launch profile followed by to debug your application, or return to the debug walkthrough as described in Section 4.4, “Running and Debugging the application”.
4.7.1. Licenses and Configuration files
The Ronetix PEEDI must of course be appropriately licensed and
configured to debug your target hardware. If the Ronetix PEEDI is
supported within the eCosPro distribution and you have not already
configured your PEEDI, an example PEEDI configuration file is placed
in the ${eCosInstallDir}/etc
sub-directory by the eCosPro build system. This is similar to the
method used for accessing example OpenOCD configuration files in
Section 4.3.3.1, “eCos Hardware Debugging using OpenOCD”.
PEEDI configuration files include a [LICENSE] section
in which the license keys for the PEEDI and the target hardware are
specified. As the licenses may also be located in a separate license
file, the generic PEEDI configuration file provided within recent
eCosPro distributions assumes that the license keys for the
PEEDI are located in the file licenses.txt
located within the PEEDI's EEPROM. The [LICENSE]
section of the configuration file therefore contains:
Example 4.7. PEEDI configuration file including “licenses.txt” file
[LICENSE]
FILE = eep://licenses.txt
In this case the file licenses.txt on the EEPROM
should contain something of the form:
Example 4.8. PEEDI “licenses.txt” file
[LICENSE]
KEY = ARM7_ARM9, 1111-2222-3333-4
KEY = UPDATE_29AUG2006, 5555-6666-7777-8
Please refer to your PEEDI documentation if you need instructions on
how to create a licenses.txt file and
store this on the PEEDI's EEPROM. Alternatively you may also create
your own configuration file where the [LICENSE]
section contains the relenvant license keys, using the configuration
file provided within the eCosPro distribution as a template,
and use the dialog below to specify the location of the new license
file for storage into the PEEDI's EEPROM.
4.7.2. Configuration and Initialization
This remainder of section describes how this configuration file can be transferred to the PEEDI using the eCosPro CDT plug-in where it is stored and used by the PEEDI for sebsequent debug sessions. This operation only needs to be performed once when the PEEDI needs to be reconfigured to debug your hardware.
Press the additional button circled in red in Figure 4.12, “PEEDI Hardware Debugging launch configuration”. This will result in a new dialog, illustrated in Figure 4.13, “Hardware Debugger Device Initialization”, appearing. This will allow you to set up your PEEDI Hardware debugger with the above-mentioned configuration file in a simple manner.
Figure 4.13. Hardware Debugger Device Initialization
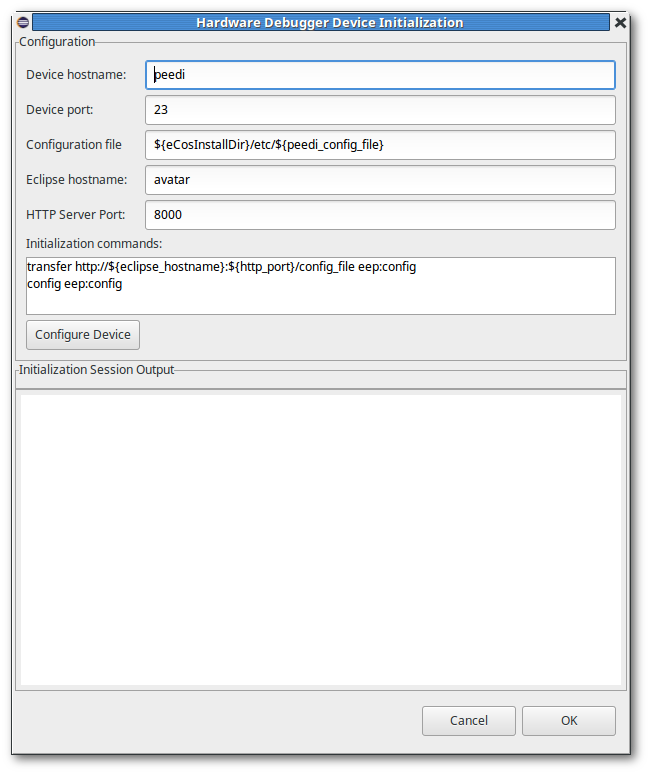
Modify the settings as required and press the button when you are ready to configure your PEEDI. The following macros are available to you as an aid to simplify your settings and allow them to transfer easily to other devices:
${eCosInstallDir}See
${eCosInstallDir}in Chapter 2, eCosPro CDT plug-in Macros.${eclipse_hostname}This defaults to the DNS hostname of the host on which Eclipse is currently running and is the value of the field Eclipse hostname within the dialog.
${http_port}This defaults to 8000 and is the value of the field HTTP Server Port within the dialog.
${peedi_config_file}This currently expands as “
peedi.cfg” by current eCosPro distributions which place a PEEDI configuration file of the same name into the${eCosInstallDir}/etcsub-directory. As the name may change depending on the configuration in future eCosPro distributions, use of the macro to name the file is recommended.
Pressing the button within the resulting dialog will result in the eCosPro CDT plug-in to:
run a mini HTTP server that serves only the PEEDI configuration file specified; and
telnet to RedBoot on the PEEDI device; and
run a predefined set of commands that will download from the HTTP server the configuration file, store it into EEPROM and configure the PEEDI to use this configuration file.
The Configuration options of the dialog, with their default values, are as follows:
- Device hostname
This is the host name of the PEEDI device. By default it is
peedi.- Device port
This is the TCP port number of RedBoot on the PEEDI device. By default it is
23.- Configuration file
This is the full pathname to physical location of the PEEDI configuration file that is to be served by the eCosPro CDT plug-in's mini HTTP server as
/config_file. By default it is${eCosInstallDir}/etc/${peedi_config_filename}, although you may also alter the field to point to your own PEEDI configuration file on your local filesystem.- Eclipse hostname
This is the host name of the development host running Eclipse and the eCosPro CDT plug-in mini HTTP server from which the PEEDI configuration file may be fetched. By default it is the name of your host, although the PEEDI configuration file may be located on any host which is reachable by the PEEDI hardware debugger. The eCosPro CDT plug-in macro
${eclipse_hostname}will be set to this value so that it can be used in the Initialization commands below.- HTTP Server Port
This is the port number on which the eCosPro CDT plug-in's mini HTTP server is to provide it's service. By default it is
8000. The eCosPro CDT plug-in macro${http_port}will be set to this value so that it can be used in the Initialization commands below.- Initialization commands
These are the set of commands, one per line, that are to be sent to Device hostname:Device port to initialise the PEEDI hardware debugger. The default is illustrated in Example 4.9, “PEEDI Initialization Commands”.
Example 4.9. PEEDI Initialization Commands
transfer http://${eclipse_hostname}:${http_port}/config_file eep:config
config eep:config
The resulting conversation between the PEEDI and the eCosPro CDT plug-in during the initialization session when is pressed may be viewed within the Initialization Session Output section.
| Warning |
|---|---|
You may need to permit incoming connections to the
|
| Notes |
|---|---|
|
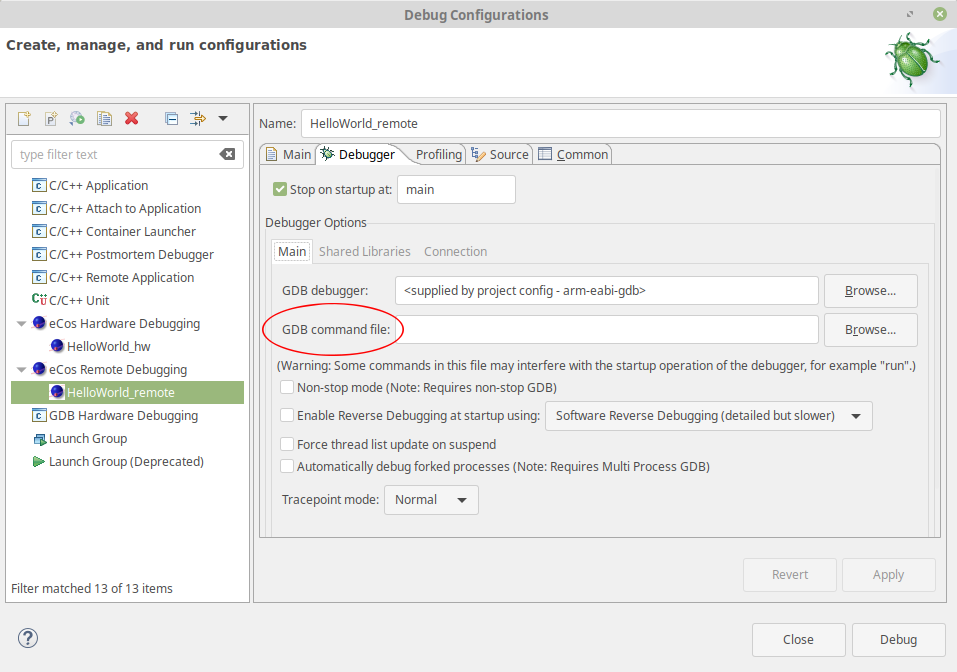
4.8. GDB command files
If necessary, it is possible to override the normal launch behaviour by
providing macros in a “GDB command file”,
traditionally named .gdbinit and located
in the same subdirectory as the executable. The path
to the file is specified on the Main sub-tab of the
Debugger panel of the eCos Remote debugging
configuration dialog, as illustrated in
Figure 4.14, “Specify GDB command file”,
and in the GDB Setup section of the
Debugger panel of the eCos Hardware debugging
configuration dialog, as illustrated in
Figure 4.11, “Hardware Launcher - ITM output via TCP/IP port”.
Figure 4.14. Specify GDB command file
The following macros will, if present, be invoked during launch:
- setup
This macro is invoked before connection to the target hardware is attempted. Within the macro,
$arg0can be used to refer to the ELF executable file which is to be debugged and$arg1will provide the connection parameters. (The connection parameters are in the correct format for the commands “file $arg0” and “target remote $arg1”.) For eCos Hardware Debugging, an additional$arg2argument is provided that is set to theJTAG Devicetype as illustrated in Figure 4.11, “Hardware Launcher - ITM output via TCP/IP port” (for example, “Generic TCP/IP”, “OpenOCD”, “PEEDI” and so on). This allows the developer to create GDB command files that cater for a variety of devices.- preload
This macro is invoked by CDT following connection to the target and before code download.
- doload
This macro is invoked by CDT to download code to the target hardware.
Note If the doload macro is present, the internal commands which would normally download the code onto the target are suppressed.
- postload
This macro is invoked by CDT immediately following code download to the target hardware.
An example gdb command file (“gdbinit”) that power-cycles a target that is to be debugged into a reset state before attempting to attach to the target is given in Example 4.10, “GDB Command File to reset hardware”.
Example 4.10. GDB Command File to reset hardware
define setup
shell relay open target
shell sleep 2
shell relay close target
shell sleep 4
end
The above script runs the command relay on the host
running Eclipse to open and close a relay switch controlling the
power to the target. It opens the relay with the name
target, effectively powering off
the target, sleeps 2 seconds to allow on-board capacitors to fully
discharge, closes the relay to power on the target and finally sleeps
for 4 seconds to allow sufficient time for the target to bootstrap into
a debug monitor and move to a state that will accept remote debug
connections to be made either via a serial connections or via a
network connection.
| Note |
|---|---|
Earlier version of Eclipse and eCosPro required a preload macro when debugging using a hardware debugger to reset and halt the target before downloading the application to the hardware. This is no longer the case for current versions of Eclipse and eCosPro. The majority of eCosCentric provided hardware debugger configuration files now will ensure the target is placed in a suitable state by the hardware debugger before or on accepting a remote debug connection from gdb, thereby allowing the application binary to be downloaded or programmed into the target by gdb's load command. |
| Warnings | ||
|---|---|---|---|
|
| | | |
| Chapter 3. Quick Start / Walkthrough |  | Chapter 5. About application projects |
| 2020-11-03 | Legal Notice |